Diabetes Mellitus encompasses a group of metabolic disorders characterized by persistent hyperglycemia resulting from defects in insulin secretion, insulin action, or both. While the clinical hallmark across all forms of diabetes is elevated blood glucose, Type 1 Diabetes Mellitus (T1D) and Type 2 Diabetes Mellitus (T2D) are fundamentally distinct diseases with different underlying etiologies, cellular mechanisms, progression pathways, and therapeutic strategies.
For healthcare providers, patients, and caregivers, understanding the physiological boundary separating T1D and T2D is vital. Misclassification can lead to inappropriate therapeutic choices—such as delaying life-saving insulin in T1D or overlooking severe insulin resistance in T2D.
🚨 CRITICAL MEDICAL DISCLAIMER & LIMITATION OF LIABILITY (1/3): MyDiaCalc, its developers, authors, and operators DO NOT PROVIDE MEDICAL ADVICE. All information, clinical concepts, diagnostic algorithms, and comparison frameworks presented in this guide are intended strictly for educational, research, and informational purposes. MyDiaCalc EXPRESSLY DISCLAIMS ALL LIABILITY for any clinical misdiagnoses, self-guided therapeutic decisions, improper insulin dosing, severe hypoglycemia, or diabetic ketoacidosis (DKA) resulting from the use of this content. Always consult a board-certified endocrinologist or qualified healthcare specialist for individual diagnosis and clinical care.
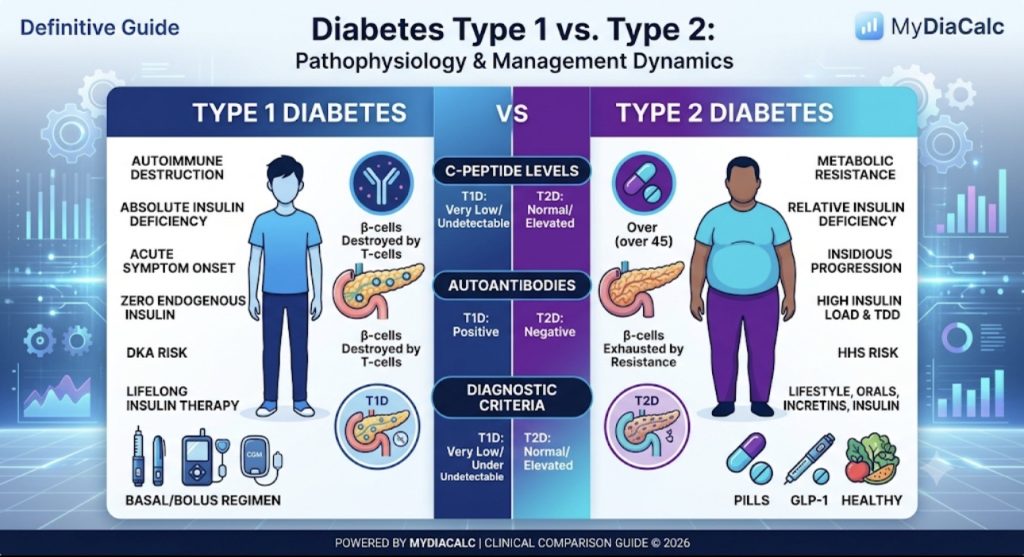
1. Pathophysiological Fundamentals: Autoimmunity vs. Insulin Resistance
The defining distinction between Type 1 and Type 2 diabetes lies in the biological mechanism that leads to metabolic failure within the body.
+———————————————————————–+
| CORE ETIOLOGICAL PATHWAYS IN DIABETES |
+———————————————————————–+
| TYPE 1 DIABETES (Autoimmune Destruction) |
| T-Cell Attack -> Pancreatic Beta-Cell Death -> Zero Absolute Insulin |
| |
| TYPE 2 DIABETES (Metabolic Resistance & Exhaustion) |
| Peripheral Resistance -> Compensatory Hyperinsulinemia -> Beta Exhaustion|
+———————————————————————–+
A. Type 1 Diabetes: Absolute Insulin Deficiency
Type 1 diabetes is primarily an autoimmune disease. The immune system mistakenly identifies the insulin-producing beta cells within the Islets of Langerhans in the pancreas as foreign targets.
- Autoantibody Cascade: Cytotoxic T-lymphocytes infiltrate the pancreas (a process known as insulitis) and progressively destroy functional beta cells.
- Key Biomarkers: Antibodies such as Anti-Glutamic Acid Decarboxylase (Anti-GAD65), Islet Antigen-2 (IA-2A), Insulin Autoantibodies (IAA), and Zinc Transporter 8 (ZnT8A) are present in circulating blood.
- Outcome: The body suffers an absolute lack of endogenous insulin, rendering survival completely dependent on exogenous insulin therapy.
B. Type 2 Diabetes: Relative Insulin Deficiency & Resistance
Type 2 diabetes is predominantly a progressive metabolic disease characterized by two converging defects:
- Peripheral Insulin Resistance: Target tissues (muscle, adipose tissue, and liver) demonstrate reduced cellular responsiveness to circulating insulin due to receptor downregulation and post-receptor signaling defects.
- Progressive Secretory Defect: Initially, the pancreas compensates by secreting higher levels of insulin (hyperinsulinemia). Over time, beta cells suffer metabolic exhaustion and lipo-glucotoxicity, leading to relative insulin deficiency.
2. Clinical Presentation and Diagnostic Differentiation
Distinguishing between T1D and T2D during initial patient presentation requires analyzing clinical symptoms alongside specific laboratory biomarkers.
+———————————————————————–+
| DIAGNOSTIC BIOMARKER MATRIX |
+———————————————————————–+
| Diagnostic Test | Type 1 Diabetes | Type 2 Diabetes |
+————————-+———————–+———————+
| Fasting C-Peptide | Very Low / Undetectable| Normal or Elevated |
| Islet Autoantibodies | Positive (≥ 1 present)| Negative |
| Ketones (Blood/Urine) | Moderate to High | Low or Absent |
| Onset Presentation | Acute / Rapid | Insidious / Slow |
+————————-+———————–+———————+
A. The Role of C-Peptide Testing
Serum C-peptide is cleaved from proinsulin in equimolar amounts to endogenous insulin. Because injected exogenous insulin lacks C-peptide, measuring fasting or stimulated C-peptide provides an exact window into natural pancreatic output:
- C-Peptide < 0.2\text{ nmol/L} (0.6\text{ ng/mL}): Strongly indicative of severe beta-cell loss consistent with Type 1 diabetes.
- C-Peptide > 0.6\text{ nmol/L} (1.8\text{ ng/mL}): Indicates preserved beta-cell function, characteristic of Type 2 diabetes or early partial remission.
B. Clinical Symptom Profiling
- Type 1 Diabetes: Typically presents acutely over weeks or days with the classic triad of Polyuria (excessive urination), Polydipsia (excessive thirst), and Polyphagia (excessive hunger), alongside unintentional rapid weight loss and severe lethargy. Diabetic Ketoacidosis (DKA) is frequently the initial presentation.
- Type 2 Diabetes: Often develops insidiously over years. Many individuals remain asymptomatic in the early stages, with hyperglycemia discovered incidentally during routine metabolic blood panels.
3. Comparative Clinical Summary Table
| Clinical Parameter | Type 1 Diabetes Mellitus (T1D) | Type 2 Diabetes Mellitus (T2D) |
| Primary Etiology | Autoimmune destruction of pancreatic \beta-cells | Insulin resistance combined with \beta-cell dysfunction |
| Typical Age at Onset | Usually childhood/adolescence (can occur at any age) | Typically adults \ge 45 years (increasing in youth) |
| Body Phenotype | Typically lean or normal BMI at diagnosis | Frequently overweight or obese (\text{BMI} \ge 25\text{ kg/m}^2) |
| Endogenous Insulin Output | Near-zero or complete absence | Normal, elevated, or moderately decreased |
| Primary Acute Risk | Diabetic Ketoacidosis (DKA) | Hyperosmolar Hyperglycemic State (HHS) |
| Core Pharmacotherapy | Exogenous Insulin (Lifelong requirement) | Lifestyle, Oral Antidiabetics, GLP-1 RAs, Insulin |
4. Dosing Dynamics and Treatment Philosophies
Pharmacological approaches for T1D and T2D diverge significantly based on underlying metabolic mechanics.
+———————————–+
| T1D vs T2D Dosing Architecture |
+———————————–+
|
+———————–+———————–+
| |
v v
+———————–+ +———————–+
| Type 1 Strategy | | Type 2 Strategy |
| – Precise Basal/Bolus| | – Insulin Sensitizers|
| – Micro-dosing (0.01)| | – Incretin Therapies |
| – Low TDD (0.5u/kg) | | – High TDD (1.0u+/kg)|
+———————–+ +———————–+
A. Management Framework for Type 1 Diabetes
Because endogenous insulin is absent, therapeutic management focuses on replicating physiological pancreatic secretion using Basal-Bolus Regimens via Multiple Daily Injections (MDI) or Continuous Subcutaneous Insulin Infusion (CSII):
- Basal Replacement: Suppresses overnight and fasting hepatic gluconeogenesis (40\%\text{ to }50\% of TDD).
- Prandial Replacement: Matches carbohydrate intake using specific Carbohydrate-to-Insulin Ratios (ICR).
- Correction Dosing: Corrects out-of-range hyperglycemia using individual Insulin Sensitivity Factors (ISF).
B. Management Framework for Type 2 Diabetes
Therapy focuses on enhancing insulin sensitivity, boosting endogenous incretin pathways, and eliminating excess glucose:
- First-Line Agents: Biguanides (Metformin) to reduce hepatic glucose output.
- Incretin Mimetics: GLP-1 Receptor Agonists (e.g., Semaglutide, Dulaglutide) and Dual GIP/GLP-1 Agonists (Tirzepatide) to enhance glucose-dependent insulin secretion, promote satiety, and lower cardiovascular risk.
- SGLT2 Inhibitors: Promote renal glucosuria, reducing vascular stress and heart failure risks.
- Insulin Therapy: Introduced when combination non-insulin therapies fail to maintain glycemic targets.
🚨 IMPORTANT MEDICAL DISCLAIMER & LIMITATION OF LIABILITY (2/3): Hypoglycemia & Medication Safety: Both intensive insulin therapy in T1D and insulin/sulfonylurea regimens in T2D carry inherent risks of severe hypoglycemia. MyDiaCalc ASSUMES ZERO LIABILITY for clinical adjustments or medication changes made without direct medical oversight.
5. Dosing Nuances and Metabolic Volatility in T1D vs. T2D
While both forms of diabetes require glycemic management, the day-to-day metabolic volatility experienced by individuals differs vastly, impacting insulin dosing requirements.
+———————————————————————–+
| METABOLIC VOLATILITY SPECTRUM |
+———————————————————————–+
| TYPE 1 DIABETES (Unstable) |
| Zero buffer -> Rapid shifts -> Carb sensitivity -> Stacking Risk |
| |
| TYPE 2 DIABETES (More Stable) |
| Residual buffer -> Dosing forgiveness -> High Insulin Load -> Slower Shifts|
+———————————————————————–+
A. Glycemic Variability in Type 1 Diabetes
Individuals with T1D operate with virtually zero metabolic buffering. There is no residual pancreatic output to smooth out glucose spikes or cushion excessive insulin absorption.
- Impact: Blood glucose can shift dramatically within 15–30 minutes due to subtle errors in carb counting, stress, illness, physical activity, or variable insulin absorption sites. Precise Time-in-Range (TIR) metrics (70\text{ to }180\text{ mg/dL}) are exceptionally challenging to maintain above 70\% without advanced technology (CGMs/AID systems).
B. “Dosing Forgiveness” and Load in Type 2 Diabetes
Individuals with T2D often retain some degree of endogenous pancreatic function, providing a crucial metabolic safety net.
- Dosing Forgiveness: An error of 1–2 units in mealtime bolusing in T2D may have a negligible impact on glucose levels due to residual beta-cell compensation. In T1D, the same error could lead to significant hypoglycemia.
- Insulin Resistance Load: The profound insulin resistance often necessitates exceptionally high Total Daily Doses (TDD) in T2D—frequently exceeding 1.0\text{ to }2.0\text{ units/kg/day}. Delivering these large volumes often requires concentrated insulins (U-200\text{ or }U-300) to minimize tissue trauma and enhance absorption.
6. Complications and Chronic Health Outcomes
The long-term microvascular and macrovascular complications are similar in T1D and T2D, but the dominant risk profiles and timeframes vary.
+———————————————————————–+
| CHRONIC COMPLICATION FOCUS |
+———————————————————————–+
| MICROVASCULAR (T1D Dominant Early) |
| Retinopathy -> Nephropathy -> Neuropathy |
| |
| MACROVASCULAR (T2D Dominant Early) |
| Cardiovascular Disease -> Heart Failure -> Stroke |
+———————————————————————–+
A. The Weight of Microvascular Complications (T1D)
In T1D, the earlier age of onset and lifelong exposure to fluctuating hyperglycemia mean microvascular complications are a significant concern.
- Focus: Strict surveillance for diabetic retinopathy and nephropathy (measured by Urine Albumin-to-Creatinine Ratio, UACR) is vital from the 5\text{-year diagnosis anniversary} mark or beginning at puberty.
B. The Burden of Macrovascular Disease (T2D)
Macrovascular complications often predate the clinical diagnosis of Type 2 diabetes due to years of undiagnosed chronic hyperglycemia, hypertension, and hyperlipidemia (collectively termed Metabolic Syndrome).
- Focus: Cardiovascular disease remains the leading cause of mortality in T2D. Contemporary therapeutic agents, particularly GLP-1 Receptor Agonists and SGLT2 Inhibitors, are now selected primarily for their documented cardioprotective and renoprotective benefits, regardless of HbA1c lowering.
7. The Blurring Boundary: Monogenic Diabetes and Double Diabetes
Classification is not always straightforward. Emerging clinical subtypes highlight the spectrum between the two primary forms of diabetes.
A. Monogenic Diabetes (e.g., MODY)
Maturity-Onset Diabetes of the Young (MODY) is often misdiagnosed as either T1D or young-onset T2D. MODY results from an inherited mutation in a single gene (monogenic) affecting beta-cell function.
- Key Differentiator: MODY patients are typically autoantibody negative, retain excellent C-peptide function, and crucially, often respond exceptionally well to specific sulfonylurea oral medications rather than requiring insulin therapy.
B. “Double Diabetes”
“Double Diabetes” occurs when individuals with Type 1 diabetes develop features of metabolic syndrome typically seen in T2D, often due to weight gain from chronic over-insulinization or poor nutrition.
- Clinical Paradox: A patient with zero endogenous insulin (T1D) develops severe systemic insulin resistance (T2D). Managing double diabetes is complex, requiring both advanced basal-bolus precision and sometimes adjunctive metabolic agents (like SGLT2i or GLP-1i) used off-label.
8. Clinical Summary Matrix
| Metric / Feature | Type 1 Diabetes (T1D) | Type 2 Diabetes (T2D) |
| Pathogenesis | Autoimmune Destruction | Progressive Metabolic Exhaustion |
| Fasting C-Peptide | < 0.2\text{ nmol/L} | > 0.6\text{ nmol/L} (Often Elevated Early) |
| Islet Autoantibodies | Positive (Anti-GAD65, ZnT8A, etc.) | Negative |
| Body Mass Index (BMI) | Lean / Normal | Obese / Overweight |
| Age of Diagnosis | Often < 20 (can occur later) | Often > 45 (increasing in youth) |
| Acute Crisis | Diabetic Ketoacidosis (DKA) | Hyperosmolar Hyperglycemic State (HHS) |
| Day-to-Day Stability | Volatile / Highly Unstable | Stable / High “Dosing Forgiveness” |
| Primary Dosing Strategy | Precise Physiological Basal-Bolus | Incretin Activation & Resistance Mgmt |
🚨 FINAL MEDICAL DISCLAIMER & LIMITATION OF LIABILITY (3/3): By utilizing MyDiaCalc, its calculators, tools, comparison charts, and educational guides, you explicitly acknowledge and agree that all therapeutic health decisions, diagnostic interpretations, and clinical management choices remain exclusively your personal responsibility or the responsibility of your licensed healthcare provider. MyDiaCalc, its authoring team, development staff, and affiliated entities SHALL NOT BE HELD LIABLE for any direct, indirect, incidental, consequential, or punitive damages resulting from the application or misuse of any calculations, guidelines, diagnostic benchmarks, or metabolic concepts presented herein. Always work directly with your licensed endocrinologist or certified diabetes care specialist to establish safe, individual treatment protocols.
Powered by MyDiaCalc © All Rights Reserved.